
Video Rating
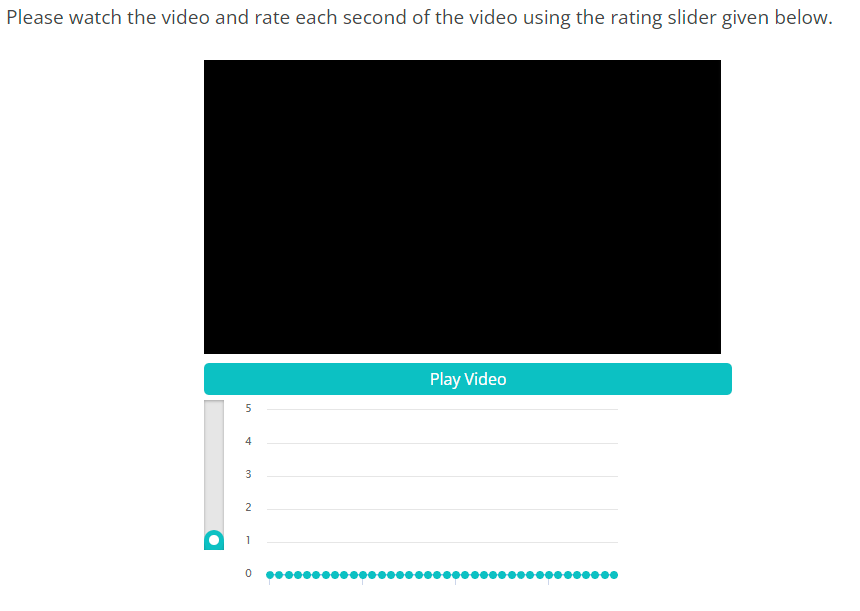
For this setup, implement the video file url in the below src attribute.
<th colspan="2"><video id="myVideo" height="300px" style="max-width: 98%;"><source src="https://surveylink.in/addVideo/demo.mp4" type="video/mp4" width="100%"></video></th>
Update the rows (for each second or a pre-determined interval) for rating as rows, so in teh below example the video is 37 second long, so we have 37 rows here for storing rating for each second. Also update the line starting with "data: [0,0,0....." with the same no. of zeroes (for each row). Also implement the no. of columns as the rating values specified (using 1-5 here).
  <radio
   label="MX12"
   builderHint="{"rocochoName":"radiogrid"}">
    <title><div id="ques_form">Please watch the video and rate each second of the video using the rating slider given below.</div><br />
<table align="center" class="v_table">
<tbody>
<tr>
<th colspan="2"><video id="myVideo" height="300px" style="max-width: 98%;"><source src="https://surveylink.in/addVideo/demo.mp4" type="video/mp4" width="100%"></video></th>
</tr>
<tr>
<td colspan="2" style="padding-bottom: 5px;">
<div onclick="playVid()" class="btn_p p1">Play Video</div>
<div onclick="pauseVid()" class="btn_p p2">Pause Video</div>
</td>
</tr>
<tr>
<td style="vertical-align: top; width: 30px;"><input type="range" min="1" max="5" step="1" value="1" id="s1" data-orientation="vertical" data-rangeslider=""><output id="js-output"></output></td>
<td>
<div id="container" style="width: 100%; height: 200px;"></div>
</td>
</tr>
</tbody>
</table></title>
    <col label="c1">1</col>
    <col label="c2">2</col>
    <col label="c3">3</col>
    <col label="c4">4</col>
    <col label="c5">5</col>
    <row label="r1">sec1</row>
    <row label="r2">sec2</row>
    <row label="r3">sec3</row>
    <row label="r4">sec4</row>
    <row label="r5">sec5</row>
    <row label="r6">sec6</row>
    <row label="r7">sec7</row>
    <row label="r8">sec8</row>
    <row label="r9">sec9</row>
    <row label="r10">sec10</row>
    <row label="r11">sec11</row>
    <row label="r12">sec12</row>
    <row label="r13">sec13</row>
    <row label="r14">sec14</row>
    <row label="r15">sec15</row>
    <row label="r16">sec16</row>
    <row label="r17">sec17</row>
    <row label="r18">sec18</row>
    <row label="r19">sec19</row>
    <row label="r20">sec20</row>
    <row label="r21">sec21</row>
    <row label="r22">sec22</row>
    <row label="r23">sec23</row>
    <row label="r24">sec24</row>
    <row label="r25">sec25</row>
    <row label="r26">sec26</row>
    <row label="r27">sec27</row>
    <row label="r28">sec28</row>
    <row label="r29">sec29</row>
    <row label="r30">sec30</row>
    <row label="r31">sec31</row>
    <row label="r32">sec32</row>
    <row label="r33">sec33</row>
    <row label="r34">sec34</row>
    <row label="r35">sec35</row>
    <row label="r36">sec36</row>
    <row label="r37">sec37</row>
    <style name="question.after"><![CDATA[
<link rel="stylesheet" href="${KEDomain}/tools/videorating/rangesliderVideo.css">

<style>
.btn_p {
    background: #0ec1c3;
    color: white;
    text-align: center;
    padding: 5px;
    margin: 0 auto;
    border-radius: 5px;
    font-size: 16px;
    cursor: pointer;
}
.btn_p.p2 {
    display: none;
}
table.v_table {
    margin: 0 auto;
}
.rangeslider__fill {
    background: #0ec1c3 !important;
	}
	.rangeslider__handle {
    background: white;
    border: 5px solid #0ec1c3 !important;
	}
	path.highcharts-point.highcharts-color-0 {
    fill: #0ec1c3 !important;
}
.rangeslider__handle:hover {
    height: 25px;
    width: 25px;
    margin-top: -2.5px;
    left: -3px;
}
.rangeslider__handle {
    width: 20px;
    height: 20px;
    left: 0;
}
.fir-hidden {
    position: static !important;
    left: 1px !important;
}
#surveyContainer
{
zoom:80%;
}
.answers {
    display: none;
}
</style>
]]></style>
    <style name="question.after"><![CDATA[
<script src="https://code.highcharts.com/highcharts.js"></script>
<script src="https://code.highcharts.com/modules/exporting.js"></script>
 <script type="text/javascript" src="${KEDomain}/tools/videorating/rangesliderVideo.min.js"></script>
 <script type="text/javascript" src="${KEDomain}/tools/videorating/rangeslider_mainVideo.js"></script>


    <script>
         var qn = ${jsexport()}; //returns json object of the question
    console.log(qn); //loads question variables into a console tool

    var resp_id=qn.uid;

var chart = Highcharts.chart('container', {
  title: {
        text: ''
    },
yAxis: {
        max: 5,opposite: false,

        tickInterval: 1
		, title: {
            text: ''
        }
    },credits: {
      enabled: false
  },exporting: {
         enabled: false
},
    xAxis: {
        labels: {
                         enabled:false,
						 }
    },
    series: [{
     showInLegend: false,
	 name : "Seconds",
        data: [0,0,0,0,0,0,0,0,0,0,0,0,0,0,0,0,0,0,0,0,0,0,0,0,0,0,0,0,0,0,0,0,0,0,0,0,0,0]
    }]
});


var vid = document.getElementById("myVideo");

setInterval(function(){

var ct=Math.round(vid.currentTime);
  ct--;
var c_range=jQuery("#js-output").text();
c_range=parseFloat(c_range);
chart.series[0].data[ct].update(c_range);
 var rrx=ct-1;
 var rrx2=c_range-1;
 document.getElementById("ans"+resp_id+"."+rrx2+"."+rrx).checked = true;

 /*SSI_SetSelect("[% QuestionName() %]_r"+ct+"_"+c_range,true);*/

}, 500);

var vid = document.getElementById("myVideo");

function playVid() {
  vid.play();
  jQuery(".p1").hide()
  jQuery(".p2").show()
}

function pauseVid() {
  vid.pause();
    jQuery(".p2").hide()
  jQuery(".p1").show()
}

	setTimeout(function(){
jQuery("#surveyContainer").css("zoom","100%");
},1000);

</script>
]]></style>
  </radio>